A wearable device for activity tracking
Winter 2023 — Python project & Arduino device
Motivation
A while ago I was inspired by a Hacker News post where a user talked about how their Apple Watch helped them exercise more by gamifying exercise. This brought up two questions:
To what extent can we track aspects of our lives to better understand our life patterns/routines? I was especially curious if I could get a sense of how much energy and focus I had throughout the day — are such variables visible in data collected by wearables, and if so could I correlate certain habits with either increasing or decreasing energy/focus? On the one hand, we already know that exercise increases energy, as do habits like a consistent wake up time. On the other hand, our memories can only store so much data about our weeks (and even so, such data is biased) so we might be able to discover more about our lives via an extra tracking method. (Implicit in that is the fact that our brains are tracking data about our lives all the time, albeit not as precicely as a wearable device might.)
To what extent would such tracking change our lives for the better? Just as with the Hacker News commenter, would tracking good habits provide a positive reinforcement loop for said habits?
Exploring Current Wearables
The first part of this project was a matter of exploring existing wearbales. Wearables that I trialed included the Oura Ring, Whoop strap, Apple Watch, Garmin Vivosmart, and a blood oxygen sensor I found on Amazon. The main focus of these wearables were biometrics like heart rate, blood oxygen, and heart rate variability. I found that over time, I wasn't super interested in these values — as far as wearable data went, I was more so curious to see what data I can track about my life. In other words, they weren't great at tracking and characterizing activities. I found myself looking at heart rate curves of my day, and trying to guess at what I was doing at each point in the day that caused the specific heart rate curve. What I really wanted was an activity classifier.
From looking at the heart rate data, I didn't think I would be able to classify a lot of my actions using heart rate data alone. The signal was just not there. Heart rate data points were taken every minute or so, so the data was not very good for distinguishing between actions where I had the same heart rate. I concluded that I would need wrist movement data, and a lot of it, if I were to classify actions with some success.
After this period of exploration, I set out to build my own wearable, with the focus being on collecting a lot more accelerometer data (at a much finer resolution) than existing wearables, and to use that data to classify actions. To keep the problem simple, I decided to use wrist movement alone, instead of combining it with some biometrics like heart rate, because my hypothesis was that the accelerometer data would have enough information for my purposes.
Building my own wearable
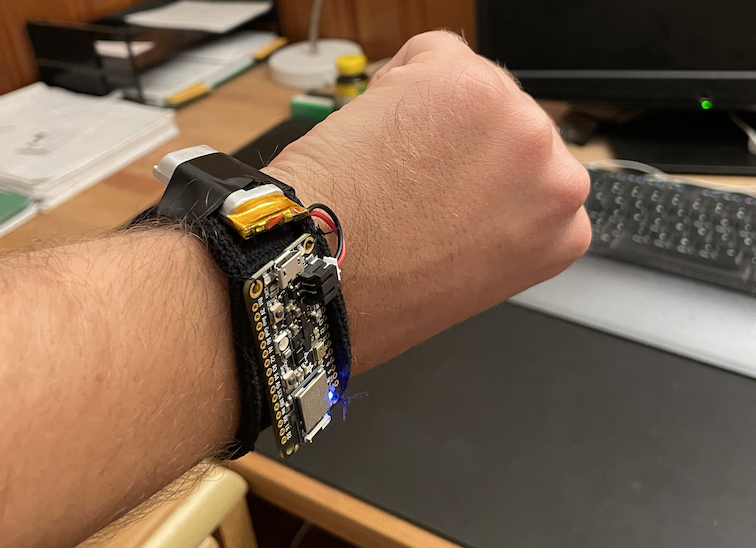
Given my lack of background in hardware development, I opted to buy an Arduino-like board from Adafruit that contained motion sensors and a bluetooth chip built in. I sewed it to a hair elastic, taped the battery onto it, and wore it on my wrist as a scrappy but functional first prototype. Here's an image of what it looked like on my wrist.
Later on in the project, I found a smaller board from Seeed Studio that also contained an accelerometer and bluetooth chip, and I was able to make a less bulky prototype (see image below). This prototype was a lot more user-friendly, and it was the first prototype that I was able to wear 24/7.

Here's a demo of the first prototype streaming accelerometer data to my computer and visualizing it in real time. The dots on the left are the three accelerometer data values (one for each x,y,z axis), and the dots on the right are the gyroscope values. Note that most of the time, one of the accelerometer values is lower than the other two because of the force of gravity always pulling in one direction.
Approach 1: collecting data, labeling, and running a classifier
My first approach for activity classification was the standard data scientist method: collect data, label it, and run your favorite supervised classifier on the data. I collected data by wearing two wearables, one on each wrist, streaming the wearable data to my laptop, then filming myself throughout the day. I would then go through the video, sync up the wearable/video data (which was timestamped) and manually label the wearable data based on what activities I saw myself performing throughout the day. Check out the example data collection video below (note the wearables on my wrist).
The activities I labeled in the video were eating, cleaning, typing, walking, and drinking. When I labeled the data, I also labeled the timestamp of the activity, so that the classifier could detect when the activity occurred, not only that it occurred within a time span. I experimented with various vanilla deep learning supervised models (CNNs, transformers).
Drawbacks
From initial tests, it became clear that I needed a lot more data than I was willing to collect in order to identify the nuanced patterns in a lot of the activities that I hoped to track. Data collection was an expensive process, after all. Additionally, if I were to build this approach into a product, I would need to run the classification on a server somewhere, since it was more compute-heavy than what the Adafruit board could handle. This would be a challenge because the wearable would need to download all of the accelerometer data onto a device, and bluetooth can only handle so much throughput. For a day's worth of data, the device would need to spend hours downloading it to a device. The device wouldn't be able to constantly stream data to a device, since we're not guaranteed that the wearable is always within range of the device. Furthermore, the accelerometer data takes up a lot of memory, which limits how long we can collect data before needing to download it to a computer.
All of these challenges indicated that the data- & comute-heavy approach was not feasible for a user facing product. I sought out a different product shape that mitigates these challenges.
Approach 2: real-time, on-device activity classification
To mitigate the problems from the first approach, I aimed to build a classifier that could run easily on the arduino device. This solves the problem of downloading data to a phone/computer, because we would only need to download the classifier output, and it solves the problem of memory, since we only need to store the classifier output in RAM.
From the first set of experiments, I noticed that there were a select few activities that had a clear, identifiable pattern in the data. These were activities where my wrist always moved roughly the same way. Examples included brushing my teeth, running, walking, typing, drinking, opening a door, and doing push-ups. Since the wrist movement was always roughly the same for these activities, I needed less data to build a reliable classifier, and the classifier wouldn't require as much computation (and therefore hopefully run on the arduino device).
Once I had a list of activities that I thought would be good candidates for this approach, I collected data by repeatedly performing these activities while wearing the wearable. This approach meant that I didn't need to film myself or label any datasets, since at the start of each data collection I would input the activity that is being captured.
After collecting data, I visualized the data by plotting the accelerometer data as a series of points in three dimensions (recall the accelerometer data is a dataset of (x,y,z,time) points). I ignored the time dimension and merely looked at how the accelerometer data moved throughout the three dimensional space, in order to validate that these actions all conform to similar patterns. Below is a video of the "drinking" action visualized in three dimensions. Each action instance is colored a different color. Note that the data all roughly conforms to a similar pattern which is easily identified by the human eye.
Writing an efficient, on-device classifier
From looking at the data, I found that all of the data of the same type of action conformed roughly to the same trajectory. In order to classify that trajectory efficiently so that it could run on the Adafruit board, I opted for a simple method: I would hand-draw boxes in the 3D space, and I would check to see whether an action would go through a series of boxes. I would use the training data to make sure that a) the boxes are drawn correctly, and b) the path of boxes traveled by the training data conforms to the same series of boxes. This approach worked since the data was fairly simple (as shown in the video above), so the general patterns of the data could also be captured in a simple way. This approach was efficient because for each new sensor reading, we needed to only check whether the data point fell within a fixed number of boxes (and indeed there's an efficient way to compute this using augmented binary search trees). As a result, this classifier was able to run on-device, and I wrote up a demo showing all classifiers running simultaneously on an input data stream.
Drawbacks
This approach had two major drawbacks. The technical drawback was that even when we're running the classifier on device, even if we had no classifier the battery life of the device was not very good. Reading the sensor data at the frequency required for this kind of activity classification would require a lot of power, and with the battery I had at the time, I only had about four hours of battery life. That was insufficient for an end product, and a bigger batter would drastically worsen the user experience (no one wants to wear a large battery on their wrist).
The second major drawback was that from a user experience perspective, classifying specific tasks didn't prove to be all that interesting. Having a list of actions over a period of time was not very useful in getting a sense of my activity throughout the day. I found that I was increasingly interested in general movement patterns instead of specific actions. Namely, I was interested in how much I was moving at specific parts of the day. Tracking general movement patterns would give me a better overview of my routine and activities, without cluttering the user experience with too many specific actions tracked. Furthermore, by using accelerometer data I would be able to characterize my movement better than if I were to use heart rate, for example.
Approach 3: general movement trends through the day
For this approach, I focused solely on tracking general movement patterns throughtout the day, namely how much I was moving, and when. This would solve the problem of data transfer and data storage, as well as the problem of battery life. From the previous approach, I discovered that I cared more about general movement patterns than about specific actions, because it gives good insight into routines & energy levels without requiring a lot of computation or excessive activity classification.
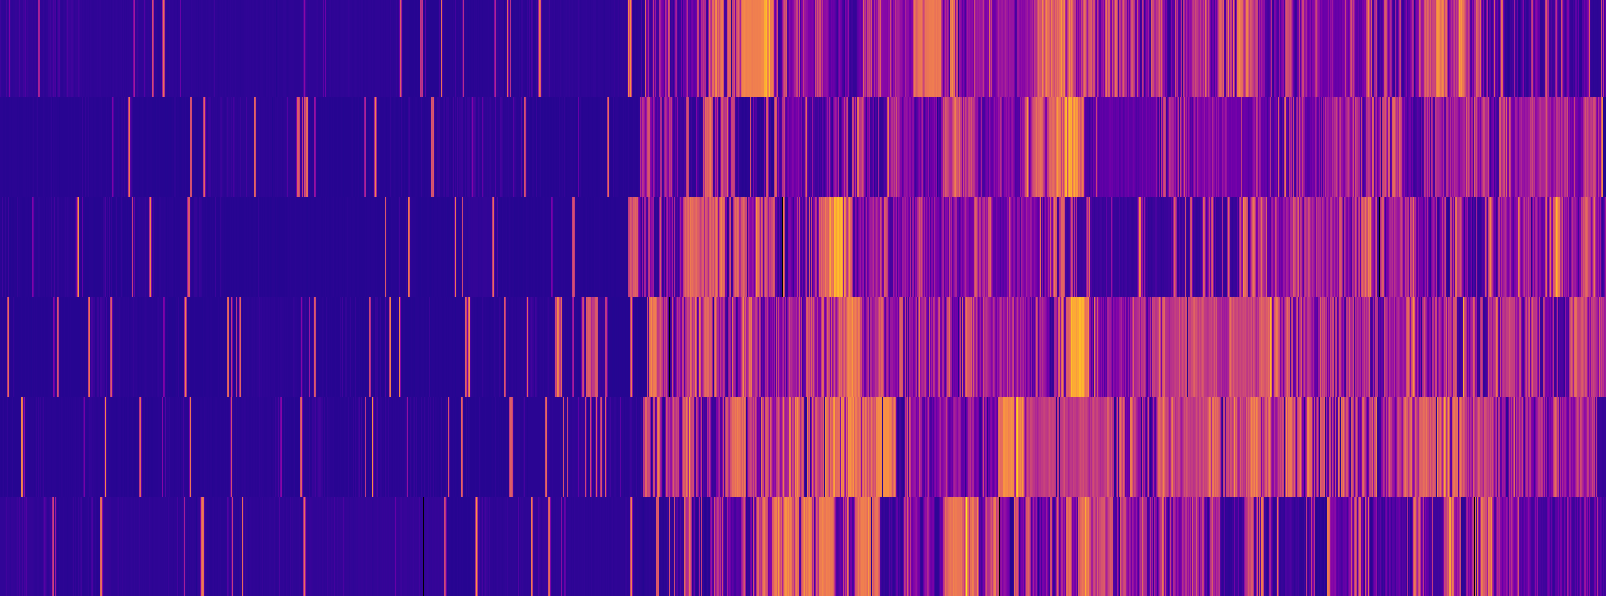
Another lesson learned from the previous approach was that different activities had different magnitudes of change between two accelerometer points in time. In other words, running vs. walking vs. stationary activities all exhibited different degrees of change in acceleration, as seen in the data visualization step. As such, my plan for this approach was simple: plot the change in acceleration for data points throughout the day. For those familiar with physics, you may know that the change in acceleration is known as the "jerk". I sought out to plot the magnitude of the jerk throughout the day. In order to make the data easily visualizable, I averaged the jerk magnitude values for 1 second windows, so that I could plot the data as a colored chart for the day without having the chart be too large. See below for an example plot over the span of a few hours. Purple is lower average jerk magnitude, yellow is higher average jerk magnitude. Each colored slit represents a one-second window, and time proceeds from left to right (a series of slits represents a series of consecutive data points).

Overall, the results from this approach were pretty compelling. I ended up with a product that a) gave me insight into my activities, and b) I could wear 24/7. The battery life for the device was roughly 1.5 days, and the data transfer took a few minutes. The device never ran out of data storage. The time it took to charge the device was about four hours. To solve the problem of tracking data while the device charged, I built a second device and swapped them out each day. Every day, I would wear one device while charging the other.
See the following examples of activities I was able to track throughout the day. Note that while I didn't code up an automatic classifier, the activities were apparent from looking at the data.
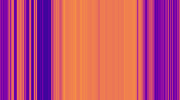


The following is example data of a few days stacked atop each other, to get a sense of trends over time. I tracked my activities like this for a few months.

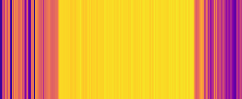
Tracking a day of hiking
I wore the device one day when out hiking with friends. After looking at the data, I was able to spot what I was doing throughout the day in the data. Here's the full day of data:

At the start of the day, I woke up, brushed my teeth, and got ready. Then I drove in the car for a few hours.

Then I hiked, with breaks throughout the hike. Note the long break in the middle once we got to the top of the mountain.

After the hike, we drove home.
A potential activity classifier
For this approach, I essentially stopped developing the product after the data visualization step. I found that it was good enough for my purposes, and as a user I didn't care as much about automatically classifying my activities since I was able to get a rough sense of the activities just by looking at the data visualization. Each activity had a unique fingerprint that was apparent in the distribution of colors over some period of time. In future work, I could explore a simple classifier that took as input datapoints a histogram of jerk values over a fixed period of time, and outputted a class for the histogram.
This is how I would setup the experiment:
Convert the time series data into a time series of histograms as sliding windows. This will look like a trace of a high dimensional point in space over time. Since windows that overlap a lot will have a similar distribution, the points in the high dimensional space will be close together, so if we plot out all the histograms for a fixed time window, it will look like a single point moving through space.
Reduce the dimensionality of the data using PCA. This will be useful so we can visualize the data in 3D space and validate that clusters naturally occur.
Run a simple clustering algorithm on the dataset.
As mentioned, this wasn't necessary for my purposes, since I was mostly interested in the user experience and product, and whether I should work toward making the wearable a real product based on interest from people. This would definitely be an interesting experiment to run on a real wearable device.
Closing thoughts
Ultimately I decided not to pursue this project further, for a few reasons.
I didn't see much demand for this device from people I talked to. Most people were content tracking biometrics using an Apple Watch or what not, and didn't feel the need to track their lives more closely. I felt like I would have a tough time selling this device if I built it into a real product, given that no one I talked to expressed interest in wearing it themselves.
While I was able to track my data 24/7 the user experience was still not great. Having to swap out the device and sync data every day became a pain. Ideally, I would have a dock at home that handled data syncing and charging, so that I would only need to swap out the wearable every day without having to worry about downloading the data.
I didn't find as much benefit to tracking myself as I thought I would, and ultimately I felt relief when I stopped tracking myself since I was tracking so much data. I didn't find that tracking myself affected my habits, and the device became just another device to maintain in my life. In summary, after a while wearing the device felt like a chore. This could definitely be mitigated by a better user experience, but if there's not a lot of value derived from the data then it makes more sense to not wear it. It was an interesting project, however!